Adjusting Stock Projected Qty Report
The Adjusting Stock Projected Qty Report calculates and displays the future inventory position for each item by combining current stock levels, purchase orders, sales orders, safety stock, and expected demand from the Expected Sales Forecast Report. It ensures accurate visibility of whether items are overstocked, balanced, or at risk of shortage.
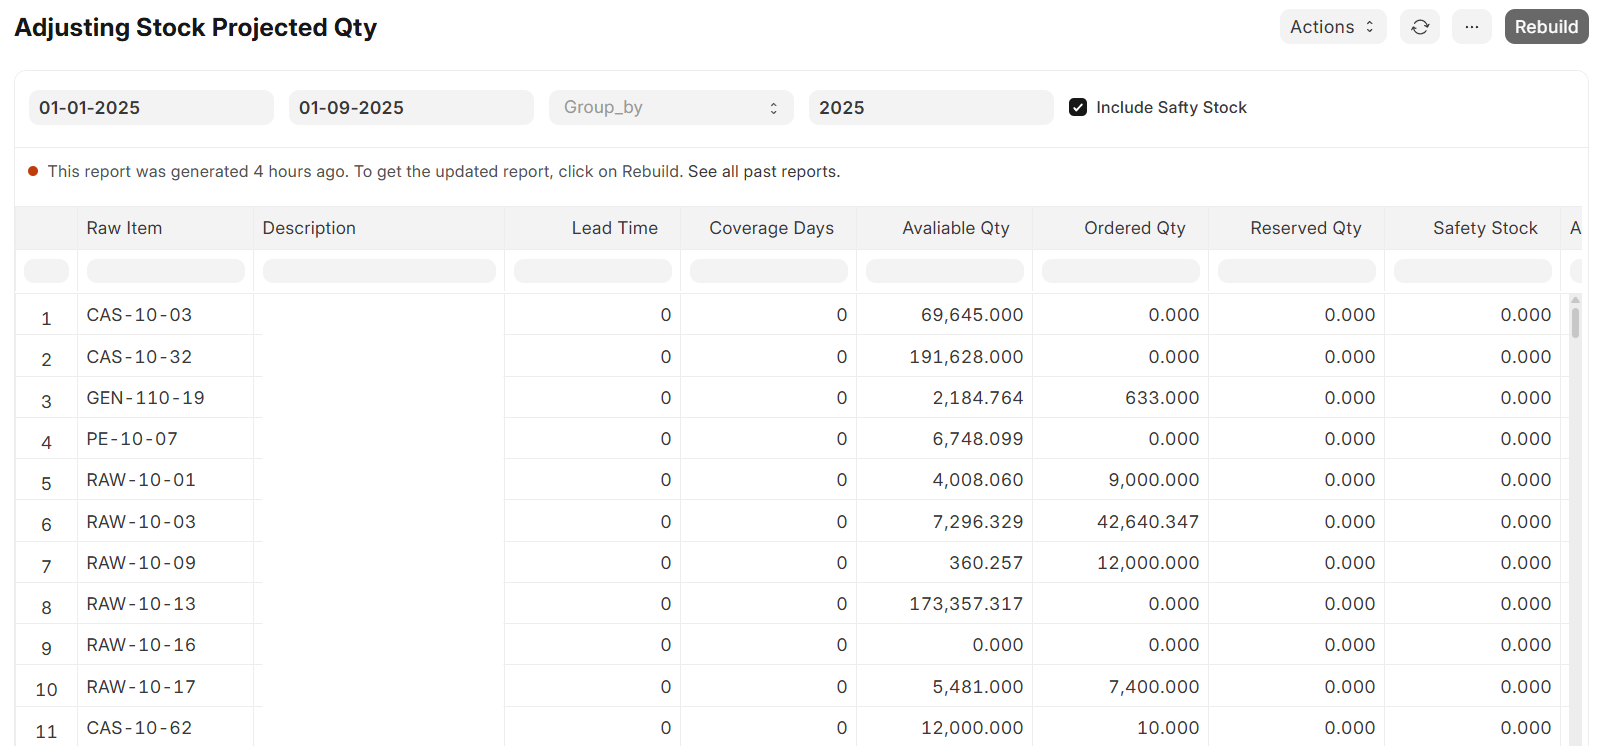
Report Columns
- Item Code – Unique identifier of the product.
- Item Name – Product description.
- Available Qty – Quantity physically available in warehouses.
- Ordered Qty – Quantity already ordered through Purchase Orders but not yet received.
- Reserved Qty – Quantity already committed to Sales Orders but not yet delivered.
- Safety Qty – Safety stock value defined in Item Master.
- Actual Safety Qty – Calculated value:
Actual Safety Qty = Available Qty + Requested Qty + Ordered Qty - Reserved Qty + Safety Qty
- Required Qty (per month) – Pulled directly from the Expected Sales Forecast Report.
- Difference Qty – Gap between projected stock and required demand:
Difference Qty = Actual Safety Qty - Required Qty
- Coverage Days – Number of days current stock can cover based on demand and lead time.
Filters
- Fiscal Year
- Start Date
- End Date
- Item Group / Item Code
Logic
- Uses Expected Sales Forecast as the demand source.
- Compares projected stock with required demand.
- Highlights shortages (negative Difference Qty).
- Provides the base for Material Request Creation.
Business Value
- Ensures proactive visibility of shortages before they occur.
- Helps procurement teams decide when and how much to purchase.
- Links directly with Material Requests → One-click creation of purchase requirements.
- Reduces risk of production stoppage due to stockouts.
